In this article I demonstrate how you might use a multiple feature regression to predict the price of the stock market.
[Note: You can follow along using my Jupyter Notebook at github here]How to predict the stock market using regression
The idea of regression is quite simple. You take one or more inputs, do some calculating and you get a numerical output. Voila! In this case, our desired output is the price of the Dow Jones Industrial Average.
OK, so what are the inputs?
For our inputs, we first need to do some thinking. What causes the stock market to rise and fall? In the short term, that's a more nuanced question. It could be anything from the news story of the day, to politics, to weather, and so on. Over the long term however, stock prices generally rise and fall with economic conditions. In this article, we will focus on long term prediction. For this particular regression, I will test the following three features (inputs) both individually and together:
- Fed funds interest rates
- Consumer Price Index
- Unemployment rate
I collected the data sets individually as csv files. I then imported the csv files, clean and manipulated the data and finally merged the data frames together. The data on each of the features went as far back as the 1950s but the only Dow data I found went back to 1985 so that is where our test starts. Leave a comment if you find monthly Dow pricing back to 1950.
On to the first regression: Fed Funds Rate
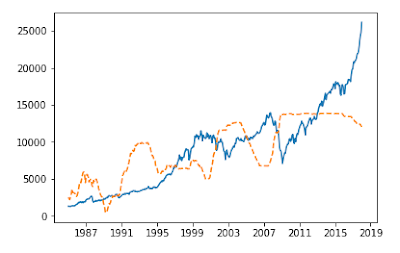
First let's start by seeing how well the fed funds rate predicts the Dow. The dotted orange line is our regression line. The blue line is the Dow over the last 33 years.
The data does not seem to fit very well. This is magnified at the beginning of the chart and could be due to the Dow prices in our model not inflation-adjusted. We will use the CPI to incorporate a measure of inflation in our next regression.
Regression using the Consumer Price Index (CPI)
The CPI is a measure of inflation as it tracks the cost of goods over time and as you can see it provides a much better fit than the fed funds feature.
Still, it doesn't really account for any of the ups and downs of the stock market so alone, it is better but still not good.
Regression using the Unemployment rate
This doesn't look good at all. A small consolation is we do have a wave like pattern with some 'valleys' around previous recessions.
Multiple regression with all three features combined
To illustrate the power and benefit of using multiple predictors, I present a multiple regression using the fed funds rate, CPI, and unemployment as our features.
This is a much better fit! As in life, a team is often more effective than an individual alone and we can see the benefits here.
Summary
The multiple regression was the clear winner of the four regressions. However, it still could be improved.
First the edges of the chart, both in 1985 and 2017, result in wide variations from the actual prices. This is exaggerated the most at the end of 2017, coincidentally the same time seemingly the entire world was transfixed by bitcoin and its endless rise.
Second, we didn't use a training/test set, cross-validation, feature normalization or any regularization. More work would be needed to have more faith in this model but over all it looks pretty good.
Finally, one might think of the model being used to predict future prices but you might also look at the slopes of the regression curve as a gauge for market transitions. Or you might look at the gap between the predicted price and actual price as a test for an oversold or overbought market. There are a number of inferences possible and I've only explored a couple here.
What other inputs do you think could improve our regression fit? Leave a comment to let me know.


Are you using asset and feature prices or do you use differencing to do the regression?
ReplyDeleteI'm using the prices as they are and not normalizing/modifying them in any way.
Delete